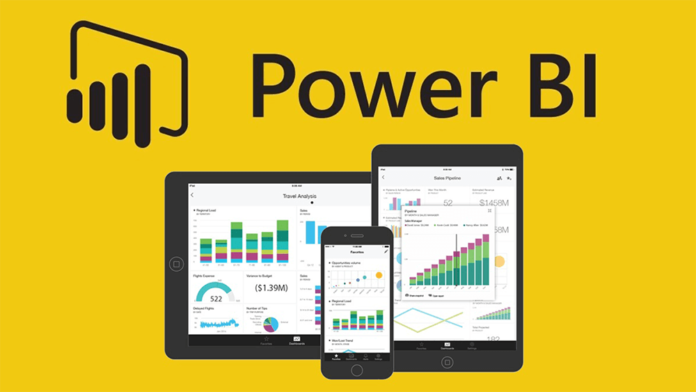
Setting up Power BI can seem daunting at first, but with the right guidance, it becomes a straightforward process. This article will walk you through the steps to set up Power BI, from installation to creating your first report. By the end of this guide, you’ll have a solid understanding of how to leverage Power BI for your data analysis needs.
Power BI is a business analytics service by Microsoft that provides interactive visualizations and business intelligence capabilities with an interface simple enough for end users to create their own reports and dashboards. It connects to a wide range of data sources and allows users to create detailed and insightful reports.
Step 1: Installing Power BI Desktop
The first step in setting up Power BI is to install Power BI Desktop, which is the primary tool for creating reports and visualizations.
- Download Power BI Desktop: Go to the official Power BI website and download the Power BI Desktop application. It’s available for free and can be installed on any Windows machine.
- Install the Application: Once the download is complete, run the installer and follow the on-screen instructions to install Power BI Desktop on your computer.
Step 2: Connecting to Data Sources
Power BI can connect to a variety of data sources, including Excel files, SQL databases, and online services like Azure and Google Analytics.
- Open Power BI Desktop: Launch the Power BI Desktop application.
- Get Data: Click on the “Get Data” button on the Home ribbon. This will open a window where you can select the type of data source you want to connect to.
- Select Data Source: Choose the data source you want to connect to. For example, if you’re connecting to an Excel file, select “Excel” and then browse to the location of your file.
- Load Data: After selecting your data source, click “Load” to import the data into Power BI.
Step 3: Transforming and Cleaning Data
Before you can create reports, you may need to clean and transform your data to ensure it’s in the right format.
- Open Query Editor: Click on the “Transform Data” button to open the Power Query Editor.
- Transform Data: Use the various tools in the Query Editor to clean and transform your data. This might include removing duplicates, filtering rows, and changing data types.
- Apply Changes: Once you’re satisfied with your data transformations, click “Close & Apply” to load the transformed data into Power BI.
Step 4: Creating Visualizations
With your data loaded and cleaned, you can start creating visualizations.
- Select Visualization Type: In the Visualizations pane, select the type of visualization you want to create, such as a bar chart, line chart, or pie chart.
- Drag and Drop Fields: Drag fields from the Fields pane onto the canvas to create your visualization. You can also drag fields onto the different areas of the visualization, such as the Axis, Values, and Legend areas.
- Customize Visualization: Use the Format pane to customize the appearance of your visualization. You can change colors, add labels, and adjust other settings to make your visualization more informative and visually appealing.
Step 5: Creating Reports
Reports in Power BI are collections of visualizations that provide insights into your data.
- Add Visualizations: Add multiple visualizations to your report by repeating the steps in the previous section.
- Arrange Visualizations: Arrange the visualizations on the canvas to create a cohesive report. You can resize and move visualizations to fit your layout.
- Add Filters: Use the Filters pane to add filters to your report. This allows you to focus on specific subsets of your data.
Step 6: Publishing and Sharing Reports
Once you’ve created your report, you can publish it to the Power BI service and share it with others.
- Sign In: Sign in to your Power BI account. If you don’t have an account, you can create one for free.
- Publish Report: Click on the “Publish” button in the Home ribbon. Select the workspace where you want to publish your report.
- Share Report: After publishing, you can share your report with others by providing them with a link or embedding the report in a website or application.
Conclusion
Setting up Power BI involves several steps, from installing the software to creating and sharing reports. By following this guide, you should now have a solid understanding of how to set up Power BI and start creating insightful reports. Remember, the key to mastering Power BI is practice, so don’t hesitate to explore its features and experiment with different types of visualizations and data sources. Happy reporting!

